Asking locally run vision-text models to classify images
In this post we play with Visual Question Answering models, multi-modal ML models capable of answering questions on images, run them on my laptop and measure their performance in detecting if there are buildings and metal buildings in images.
Context
As part of an architecture researh project in deep energy retrofits, we wanted to obtain a set of publicly-owned metal prefabricated buildings in Québec. These buildings were considered good candidates to develop a scalable retrofit protocol given the project's partnership with provincial government and other architectural considerations. Starting with a database of all the lots in Québec, we extracted around 13,000 lots using public-related land-use codes that were likely to contain metal prefab buildings (like arenas, parks and community centers).
After scraping streetview images for each of these lots, I wanted a way to automatically identify the metal buildings, the alternative being humans sifting through the images. Let us leverage technology to reduce human labor! This prompted some research into available vison models at that time (Summer 23).
This was likely going to be a one-time task, so I did not want to go through many long hours of ML model development, something I had no experience, with no certainty of success and requiring expensive hardware (we did have access to research super-computers that I never got around to play with in the end 😔). Instead, I was hoping to find a pre-trained model to use for this problem, but although there has been a lot of work in extracting buildings from aerial photos, I could not find existing models for the task at hand.
At the time, my coworker and I were looking into image classifiers, segmenters and object detection models looking for ways to apply them. We also looked at popular vision model training sets, reasoning that models training using them would recognize buildings. For example, the CIFAR-100 dataset has a category for "large man-made outdoor things" which was promising, ImageNet has categories for special buildings like churches and bakeries. I was hopeful with the Cityscapes dataset, but buildings are considered just as background.
Then I found the LAION dataset. Unfortunately, the explorer site is now broken (the KNN backend returns a 502 error at the time of writing) so you'll have to trust me on this, but the dataset actually contained metal prefab buildings! I then looked into models which had trained on LAION and this led me to finally using the BLIP model (paper and nice video about it) which can be used for Visual Question Answering (VQA).
Plan
So, the idea was to ask the VQA model a set of yes/no questions for each image of a lot, and use the answers to estimate the probability that the lot contains a building and metal building. The results can then be ordered for more time-efficient human analysis, without having to discard photos of empty lots and non-metal buildings, or we could determine a threshold and discard those falling below.
After struggling to refresh my basic stats and probabilities, buying a cool textbook that I will never finish, playing with bayesian networks and giving up, I figured that by considering each question as a binary/diagnostic test, we can use simple bayesian statistics and this great stack exchange response to combine the test results and obtain a formula for the probability of each event, given the test results (see math below).
Results
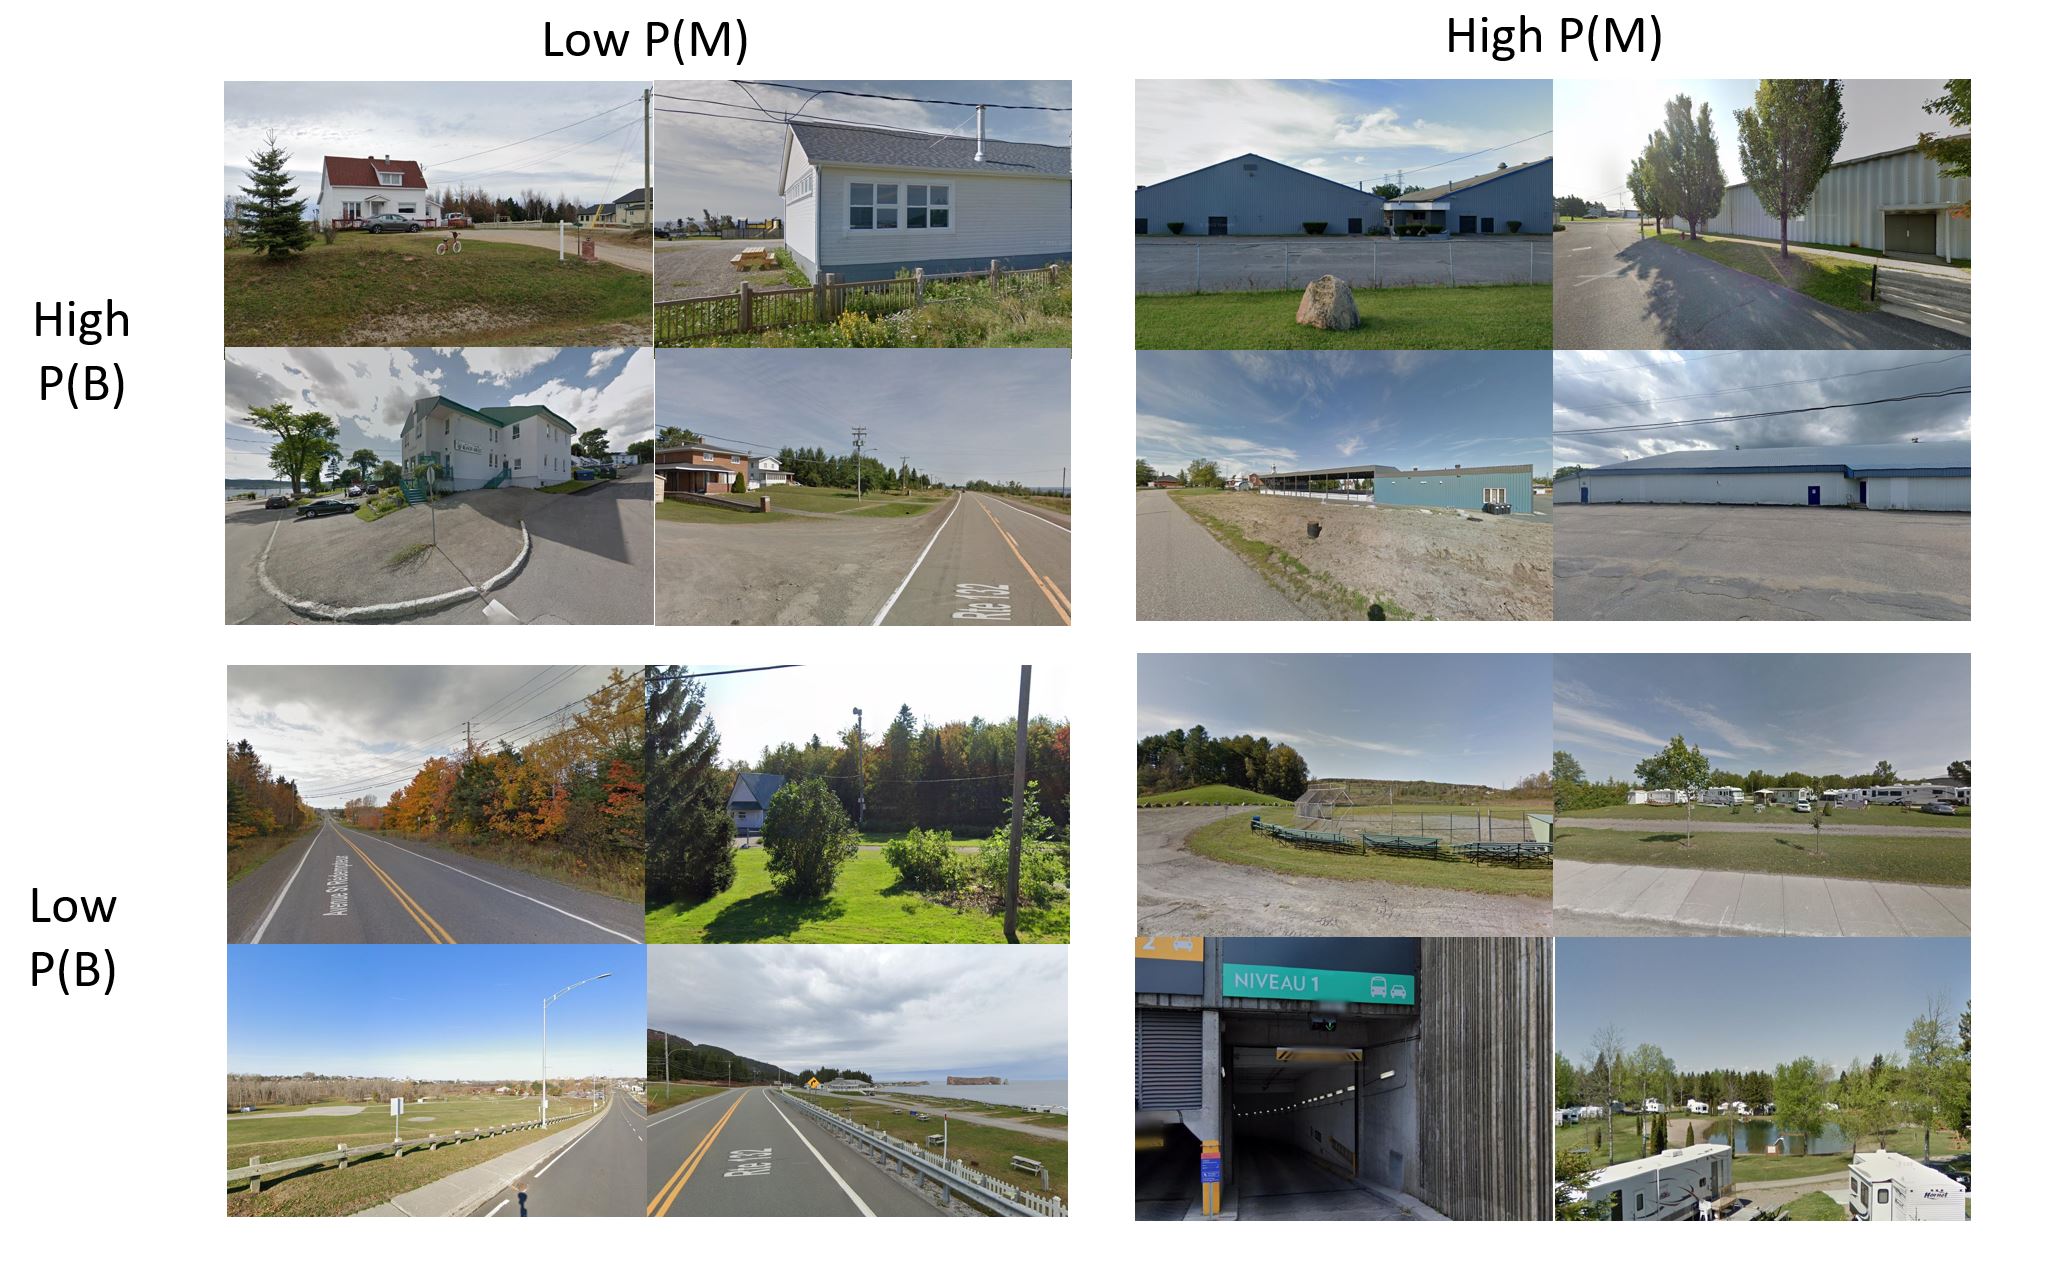
In the end, using BLIP running on my laptop I was able to process the ~90k images and estimate for each the probability that it contained a building P(B) and a metal building P(M). After averaging a lot's image's scores, we can order the lots by P(B) and P(M) descending to get the candidate building list ordered from best to worst. To make this a proper classifier, we can set a threshold and determine the class based on that, e.g. P(M) > .5 for metal buildings, P(M) < .5 and P(B) > .5 for non metal buildings and no building for everything else.
The Low P(B)/High P(M) cases in the image below, are those that tricked the model into thinking they were metal buildings. We can see that street signs, RV parks, metal fences all trigger the 'metal detecting' part of the model. Overall, I was very happy with the results.
Note: This work was done in the summer of 2023, before GPTs offered multi-modal capabilities. It would be interesting to measure it's performance on the same task! The models described in this post however will only cost you the elctricity needed to run your computer.
Methodology
The VQA model is asked the following questions:
Is a building clearly visible?
Is there a building in the image?
Is a building present in the image?
Can you clearly see a building in the image?

Is there a metal prefabricated building in the image?
Is there a metal prefabricated building?
Is there a metal building?
If there is a building, what is it made of?
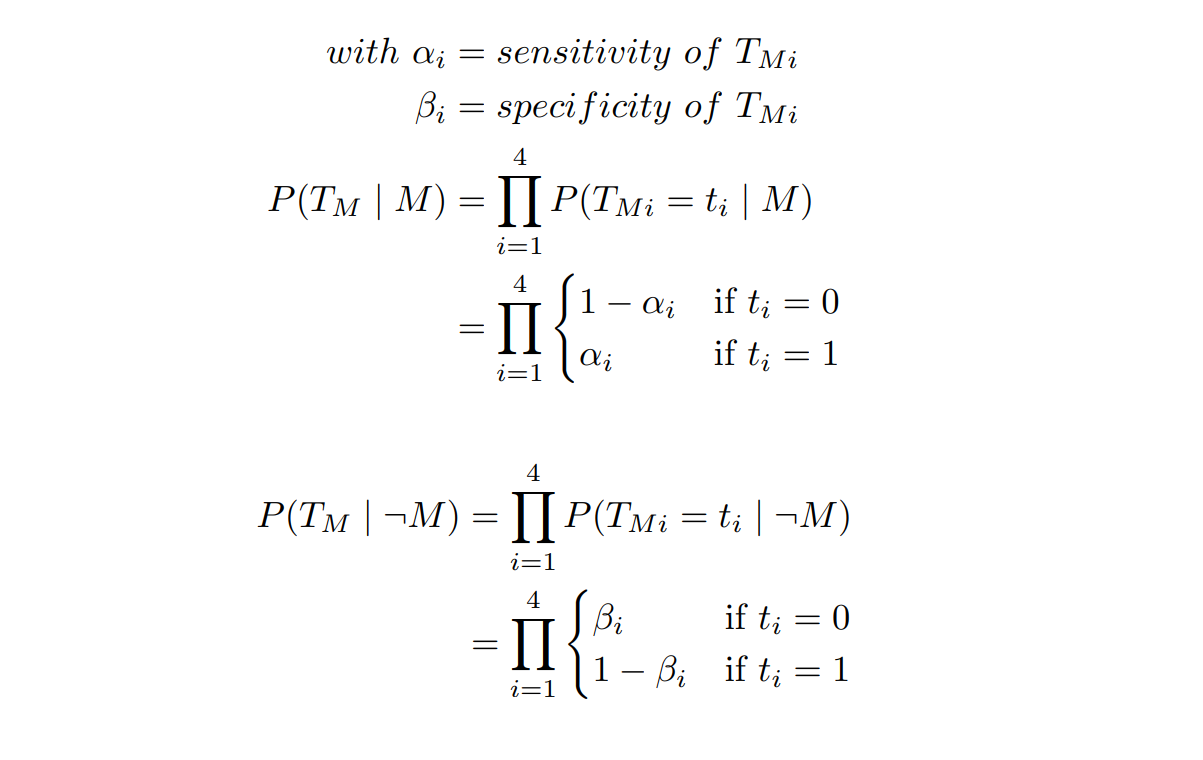
We consider each question as an independent binary test. The first 4 test if there is any building, the second 4 if there is a metal building. If the model answers "yes" the test is considered positive, else it's negative. For the last question, we check if the answer contains "metal" or not instead. In practice, I've found that the VQA models would always answer with a single word for these questions.
That's all great, except once the model answers, how much we can trust its answers? To quantify that, the most intuitive measure to me is the probability that there is a building (or that it is metal) based on the test results, or P(M | T_M). I don't know what to call this measure exactly, but I guess it's a sort of combined predictive value of the tests.
To compute it, we can use Bayes' theorem and follow this great stack exchange response.
Let T_M be the set of answers to the questions (the test results) and P(M) be the probability of a metal building being on the lot. Then P(M | T_M) is the probability of a metal building given the test results and is given by

where
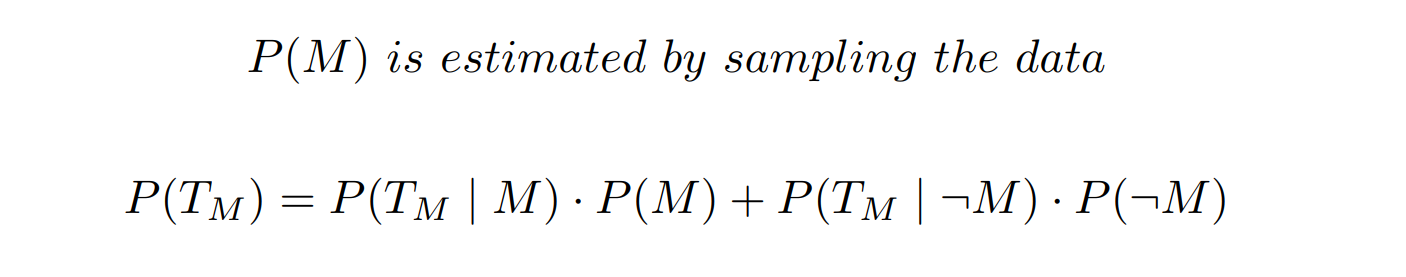 (by sampling the data, I mean go through random cases counting the occurence of the metal buildings)
and
P(B) and P(M) were estimated by randomly sampling the data until obtaining 30 occurrences of the target class. They were measured to be .65 and .11, respectively.
Now we also need to measure the sensitivity and specifity of each question. From our 10k cases, we'll randomly select a few of each class to serve as our "measuring set" (instead of eval/test set) and run the model against it. Knowing the class of each case, we'll be able to count the number of true/false positivesand compute the sensitivty and specificity of each test.
Here are the results of measuring the sensitivity/specificity of the model. I included measurements for the ViLT model which can be used for the same task as a comparison. I chose BLIP since it ran faster and seemed to have higher sensitivity for most tests, but I'm not sure how exactly to interpret these results to form any conclusions about the relative performance of the two models.
| Model | Question | TP | FP | TN | FN | Sensi | Speci | PPV | NPV |
|---|---|---|---|---|---|---|---|---|---|
| blip-vqa-capfilt-large | |||||||||
| Is a building clearly visible? | 853 | 109 | 176 | 26 | 0.9704 | 0.6175 | 0.8867 | 0.8713 | |
| Is there a building in the image? | 853 | 106 | 179 | 26 | 0.9704 | 0.6281 | 0.8895 | 0.8732 | |
| Is a building present in the image? | 852 | 108 | 177 | 27 | 0.9693 | 0.6211 | 0.8875 | 0.8676 | |
| Can you clearly see a building in the image? | 858 | 123 | 162 | 21 | 0.9761 | 0.5684 | 0.8746 | 0.8852 | |
| Is there a metal prefabricated building in the image? | 135 | 342 | 658 | 29 | 0.8232 | 0.6580 | 0.2830 | 0.9578 | |
| Is there a metal prefabricated building? | 133 | 307 | 693 | 31 | 0.8110 | 0.6930 | 0.3023 | 0.9572 | |
| Is there a metal building? | 112 | 155 | 845 | 52 | 0.6829 | 0.8450 | 0.4195 | 0.9420 | |
| If there is a building, what is it made of? | 110 | 48 | 952 | 54 | 0.6707 | 0.9520 | 0.6962 | 0.9463 | |
| vilt-b32-finetuned-vqa | |||||||||
| Is a building clearly visible? | 717 | 19 | 266 | 162 | 0.8157 | 0.9333 | 0.9742 | 0.6215 | |
| Is there a building in the image? | 844 | 84 | 201 | 35 | 0.9602 | 0.7053 | 0.9095 | 0.8517 | |
| Is a building present in the image? | 841 | 73 | 212 | 38 | 0.9568 | 0.7439 | 0.9201 | 0.8480 | |
| Can you clearly see a building in the image? | 814 | 54 | 231 | 65 | 0.9261 | 0.8105 | 0.9378 | 0.7804 | |
| Is there a metal prefabricated building in the image? | 149 | 427 | 573 | 15 | 0.9085 | 0.5730 | 0.2587 | 0.9745 | |
| Is there a metal prefabricated building? | 150 | 448 | 552 | 14 | 0.9146 | 0.5520 | 0.2508 | 0.9753 | |
| Is there a metal building? | 111 | 111 | 889 | 53 | 0.6768 | 0.8890 | 0.5000 | 0.9437 | |
| If there is a building, what is it made of? | 20 | 5 | 995 | 144 | 0.1220 | 0.9950 | 0.8000 | 0.8736 |
And here are the model runtimes on my laptop (Lenovo Thinkbook 15 Gen2 with AMD Ryzen 5 4500 U and 16GB RAM):
| Model | avg s/img |
|---|---|
| BLIP | 3.099 |
| Vilt | 3.821 |
Bonus
Since doing this work, I decided to try training a few classifiers for this task using the BRAILS framework. Using a (porobably too small) dataset, I trained 4 different architectures and measured their performance following this article for multi-class classification. In order to compare the VQA models' performance, I set a threshold of 0.5 to classifiy the cases like so:
P(M) > .5 -> metal buildings, P(M) < .5 and P(B) > .5 -> non metal buildings and no building for everything else.
| Model | Accuracy | Recall (micro) | Recall (macro) | Precision (micro) | Precision (macro) | F1 (macro) | F1 (micro) |
|---|---|---|---|---|---|---|---|
| convnextb | 0.5145 | 0.5145 | 0.4032 | 0.5145 | 0.3034 | 0.5145 | 0.3208 |
| convnexts | 0.5242 | 0.5242 | 0.3881 | 0.5242 | 0.3106 | 0.5242 | 0.3209 |
| efficientnet2m | 0.5640 | 0.5640 | 0.4081 | 0.5640 | 0.3363 | 0.5640 | 0.3513 |
| efficientnet2s | 0.5870 | 0.5870 | 0.4115 | 0.5870 | 0.3519 | 0.5870 | 0.3628 |
| blip-vqa-capfilt-large | 0.6316 | 0.6316 | 0.4205 | 0.6316 | 0.3951 | 0.6316 | 0.3930 |
| vilt-b32-finetuned-vqa | 0.7237 | 0.7237 | 0.4438 | 0.7237 | 0.4565 | 0.7237 | 0.4460 |
We see that accuracy and micro recall are equal for multiclass classification.
We see that off all the BRAILS models, efficientnet2s is the best, even though it's the smallest model! Perhaps it has something to do with the small size of the training set, with a small model better able to utilize it. Overall, ViLT outperforms all the other models with the test threshold. It could be interesting to try other thresholds and see how it affects the classifier performance of the VQA models.
You can recreate these results by running the code here: https://github.com/lhovon/vqa-models-buildings
Conclusion
This is mostly me playing data scientist, if you found some glaring mistakes or thought this did not make any sense, please let me know. I'd be happy to learn more about this subject.
Overall, I was very happy with the results from BLIP. It was cool to be able to run a model and actually solve a real problem using it, all without requirting expensive hardware.
Notes
The two models are bad at following instructions. For example, if told
Reply 'no_bldg' if no building is visible, 'metal' if a metal building is visible and 'not_metal' if a non-metal building is visible
they will both consistently answer by yes/no instead.